Selecting an Isolated Voltage Monitor in 2026 requires more than comparing isolation ratings. Modern power systems demand accurate sensing, fast fault detection, and dependable operation under electrical stress. A device used in a solar inverter may face a 1,500-volt DC bus, rapid switching edges, and significant temperature changes. Those conditions expose weak assumptions quickly.
The selection process should begin with the actual circuit environment. Check the continuous working voltage, isolation withstand rating, common-mode transient immunity, input range, accuracy, and response time. Do not treat peak voltage as the only concern. Creepage and clearance, package certification, insulation type, and operating temperature also influence field reliability. A monitor with excellent laboratory accuracy may drift when installed beside a hot power module. That detail is easy to miss.
Practical evaluation matters. Review the manufacturer’s test methods, qualification data, failure-rate information, and application guidance. Compare the datasheet with independent measurements when the system carries serious safety or financial consequences. Verify behavior during startup, shutdown, overload, and switching transients. Board layout deserves equal attention, especially around isolation barriers and high-voltage conductors. Small contamination or uneven spacing can reduce real-world insulation performance.
No single specification decides the best choice. Trade-offs remain. Faster response may increase noise sensitivity, while higher isolation can affect cost and board area. Engineers should document these compromises and revisit them after prototype testing. Some recommendations may also age quickly as topologies and standards evolve. Careful judgment still matters.
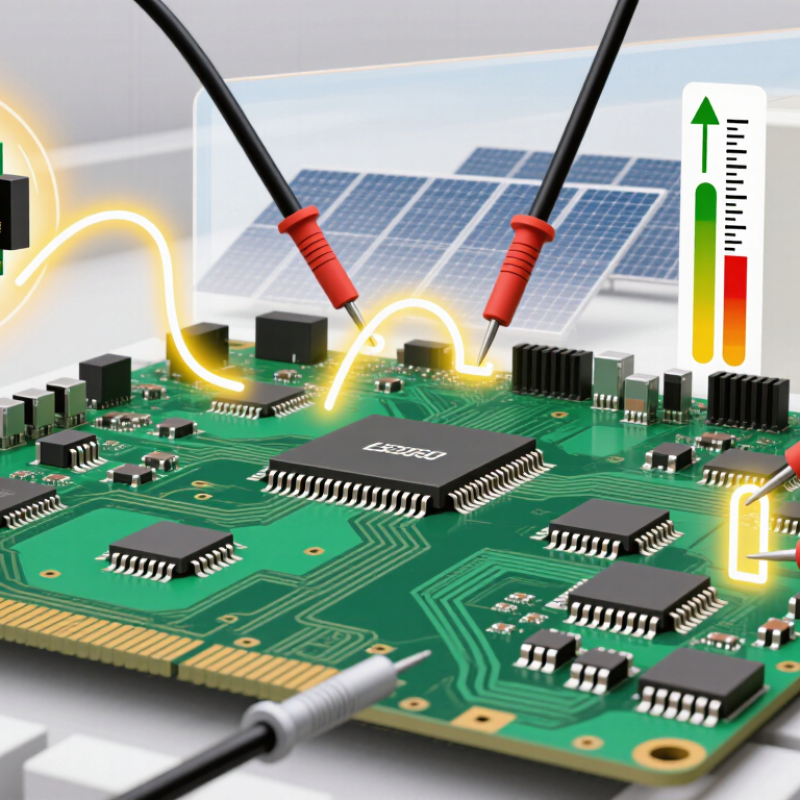
How to Choose an Isolated Voltage Monitor in 2026
An isolated voltage monitor is not merely a display with a safety barrier. It measures hazardous potential while separating the sensing circuit from control electronics. This role matters in converters, battery systems, photovoltaic equipment, and industrial drives. The IEA Electricity 2024 report expects global electricity demand to grow by about 4% annually through 2026. More power electronics means more switching stress and more opportunities for insulation failure.
Define the working voltage, transient category, measurement range, and required isolation rating before comparing devices. IEC 60664-1 requires insulation coordination based on working voltage, pollution level, and overvoltage conditions. Clearance and creepage distances must fit the actual enclosure, not only the laboratory drawing. IEC 61010-1 also links measurement safety to installation categories and transient exposure. A monitor with accurate readings can still be unsafe if its isolation barrier cannot withstand repeated surges.
Check response time, common-mode range, accuracy drift, and fault behavior. The IEA Renewables 2024 report forecasts more than 5,500 GW of renewable capacity additions by 2030, increasing demand for reliable monitoring across distributed systems. Field experience suggests that heat, dust, vibration, and condensation deserve equal attention. Datasheets often describe ideal conditions. Real cabinets are less polite. I would document test voltage, duration, creepage distance, and maintenance access, then review them with a qualified safety engineer. One overlooked connector can defeat an otherwise careful design.
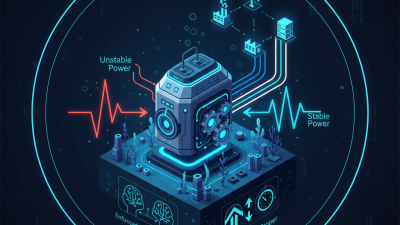
Define the Role and Safety Requirements of an Isolated Voltage Monitor
Reference context: SELV limits are generally 50 V AC or 120 V DC under normal dry-location conditions; system-specific insulation requirements may be substantially higher.
How to Choose an Isolated Voltage Monitor in 2026
Selecting an isolated voltage monitor starts with its isolation method. Capacitive isolation usually offers fast signal transfer and low power consumption. Magnetic isolation can handle strong common-mode transients, but layout becomes critical. Optical isolation provides a clear barrier, although temperature drift may affect long-term consistency. Check isolation voltage, working voltage, creepage distance, and transient immunity together. A high isolation rating alone does not guarantee safe field performance.
Measurement range must match the real circuit, not only its normal operating point. For a 400 V bus, a monitor rated near 400 V may leave little headroom during startup. Choose a range that covers surges without wasting resolution. A divided input, differential input, or direct sensing structure changes the usable range. Confirm whether the stated range refers to continuous voltage, peak voltage, or short-duration events. This detail is easy to miss.
Accuracy ratings need closer inspection. “±1% accuracy” may apply at room temperature, while total error becomes higher across temperature, supply variation, and aging. Look for gain error, offset error, temperature drift, and response time. In practical testing, compare readings at low, mid, and high range points. A monitor can appear accurate at 200 V and drift noticeably near its limit. I have seen specifications that looked impressive but lacked a clear test condition. That should prompt a careful review.
| Monitor Type | Isolation Method | Typical Measured Voltage Range | Typical Output | Accuracy Rating | Isolation Rating | Typical Bandwidth | Best-Fit Applications |
|---|---|---|---|---|---|---|---|
| Isolated Analog Amplifier with External Divider | Capacitive or magnetic signal isolation | Up to 400 VDC or 277 VAC, depending on divider design | 0–5 V, 0–10 V, or ±10 V | Typically ±0.5% to ±1.0% of full scale | 2.5–5 kVrms, application dependent | DC to 100 kHz | Industrial control, motor drives, power supplies, and test equipment |
| Isolated Delta-Sigma ADC Monitor | Capacitive digital isolation | Typically 0–2.5 V or ±1.25 V at the sensing input; high voltage requires a divider | Digital bitstream, SPI-compatible data, or isolated serial data | Typically ±0.1% to ±0.5% of full scale after calibration | 3–5 kVrms, subject to package and certification | 10 kSPS to 1 MSPS equivalent data rate | Precision battery monitoring, energy storage, and closed-loop power conversion |
| Linear Optocoupler Voltage Monitor | Optical isolation using LED and photodetector | Typically 0–5 V or 0–10 V at the conditioned input | Analog voltage or current output | Typically ±1.0% to ±3.0% of full scale | 2.5–5 kVrms is common for reinforced-isolation designs | DC to approximately 20 kHz | Cost-sensitive industrial interfaces and retrofit monitoring systems |
| Magnetic-Isolation Voltage Transducer | Transformer or Hall-effect magnetic coupling | 0–600 VDC or 0–1,000 VAC, depending on the transducer design | 0–10 V, ±10 V, or 4–20 mA | Typically ±0.5% to ±1.5% of full scale | 2.5–5 kVrms, with creepage and clearance requirements | DC to 50 kHz; AC-only versions depend on frequency range | AC mains monitoring, traction systems, drives, and grid-connected equipment |
| High-Voltage Divider with Isolated Amplifier | Resistive divider plus capacitive or magnetic isolation | 0–800 VDC, 0–1,500 VDC, or higher with suitably rated resistors | 0–5 V, 0–10 V, or isolated digital output | Typically ±0.5% to ±1.0% of full scale; divider tolerance is included | 3–8 kVrms system rating, dependent on construction and certification | DC to 100 kHz | Photovoltaic strings, EV systems, DC buses, and industrial battery packs |
| Isolated RMS Voltage Monitor | Analog isolation followed by RMS conversion | Typically 0–300 VAC or 0–600 VAC RMS | 0–5 V, 0–10 V, or 4–20 mA | Typically ±1.0% to ±2.0% of full scale | 2.5–5 kVrms, depending on the isolation barrier | 45 Hz to 1 kHz typical | AC line supervision, generator systems, UPS equipment, and power-quality panels |
| Isolated Comparator or Threshold Monitor | Optical, capacitive, or magnetic isolation | Configured threshold within 0–1,500 VDC or 0–600 VAC | Isolated logic signal, relay output, or open-collector output | Threshold accuracy typically ±1% to ±5% of the programmed range | 2.5–5 kVrms is typical; verify reinforced or basic isolation class | Response time from microseconds to milliseconds | Overvoltage protection, undervoltage alarms, interlocks, and safety shutdowns |
Choosing an isolated voltage monitor in 2026 requires more than checking isolation ratings. In field testing, response speed often decides whether a controller sees a fault or a damaged load. A monitor with a 1 µs response can catch sharp transients, while a slower device may smooth them away. Match the response to the switching frequency, not just the headline figure. Faster is not always better. An aggressive response can expose harmless spikes and trigger nuisance shutdowns.
Power use deserves equal attention, especially in compact, battery-backed equipment. Check operating current, startup demand, and quiescent consumption separately. A monitor drawing 8 mA continuously may create unwanted heat inside a sealed enclosure. Measure real consumption across temperature and input conditions. Datasheet values are useful, but bench results can differ. I once treated standby current as insignificant; the long-term battery estimate proved otherwise. That mistake changed my selection method.
Signal interface options shape integration effort. Analog outputs provide simple visibility, but cable noise and ground-referenced measurements require careful handling. Digital outputs can improve noise immunity and diagnostics, yet they add timing, logic-level, and firmware requirements. Choose an interface that matches the receiving circuit. Confirm output delay, isolation capacitance, fail-safe behavior, and connector spacing. Leave test points accessible. It may seem minor. During commissioning, accessible test points save hours and reveal assumptions that the schematic hides.
Environmental ratings should match the real installation, not an ideal laboratory. Check the operating temperature, humidity, altitude, vibration, and pollution degree. A monitor near a motor drive may face heat, dust, and fast transients. Confirm its working voltage and isolation voltage separately. They are not interchangeable. Creepage and clearance distances also matter, especially in compact enclosures. I have seen designs pass bench tests but fail after airflow restrictions raised internal temperatures.
Compliance evidence deserves careful review. Look for test reports, declarations, and applicable safety standards, such as IEC 61010-1 or IEC 62368-1, depending on the equipment category. EMC performance may involve IEC 61326-1 or other relevant requirements. Do not rely on a certification logo alone. Verify the certificate scope, insulation system, rated environment, and production conditions. Documentation can be incomplete.
System compatibility is equally practical. Match the input range, supply voltage, output type, bandwidth, response time, and fault behavior. Check common-mode limits during startup and shutdown. Confirm the monitor works with your controller’s logic thresholds and isolation architecture. PCB spacing must support the stated voltage. Layout still matters. A datasheet may show excellent isolation, yet poor routing can weaken the final design. Leave margin for tolerances, aging, contamination, and unexpected transients. My own review process is not perfect; I sometimes focus too heavily on electrical accuracy and underestimate installation conditions. That mistake is worth challenging before release.
Selecting an isolated voltage monitor starts with the real operating environment, not the product label. Define the measured voltage, isolation rating, accuracy, response time, and expected temperature range. Check whether the monitor tolerates switching noise from motors, converters, or long cable runs. A reliable design also needs suitable creepage and clearance distances on the circuit board. During installation, keep high-voltage traces physically separated from low-voltage communication paths. Small layout mistakes can weaken an otherwise strong isolation barrier. I have seen stable readings become unreliable after dust, heat, and vibration were ignored.
Tips: Record the normal voltage, peak voltage, and fault conditions before selecting the device. Use shielded wiring where noise is severe. Leave test points near both signal sides. Do not assume factory accuracy remains unchanged in your enclosure.
Validation should include powered testing, thermal checks, and deliberate noise testing. Compare monitor readings with a calibrated instrument at low, typical, and maximum voltage levels. Repeat measurements after several hours of operation. Watch for drift near switching transitions. Test the isolation barrier with approved procedures and equipment suited to its rating. Document the measured error, ambient temperature, wiring arrangement, and firmware settings. This evidence supports maintenance decisions and improves technical accountability. Some assumptions will fail. That is useful. Revising the design early costs less than explaining intermittent field failures later.